Task Debugging
Template testing
Task test
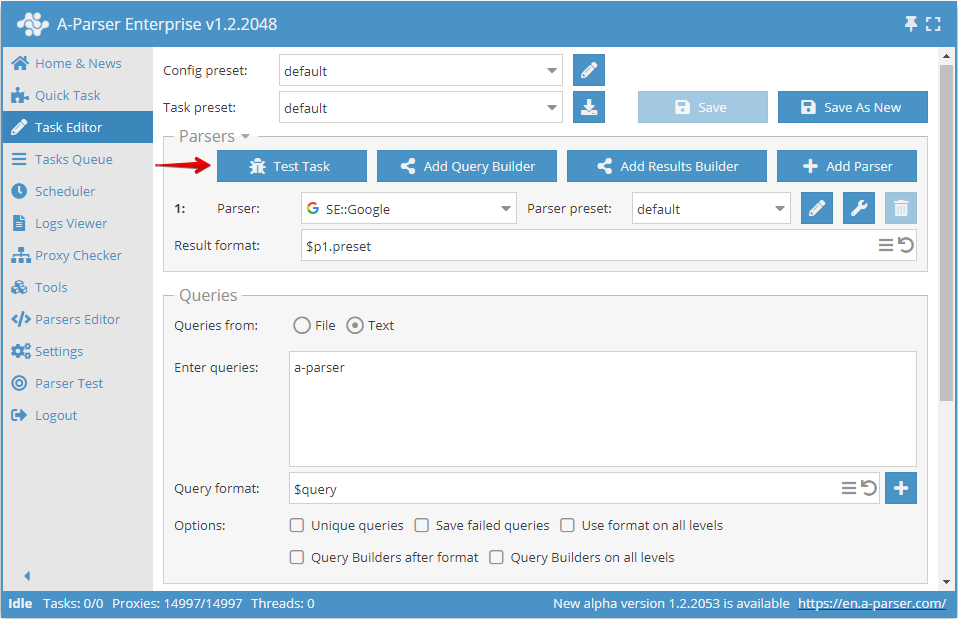
The task tester allows you to test the entire preset completely, including multiple scrapers and Builders. The entire workflow can be monitored thanks to the log display for each thread and results viewing. All data is updated in real time.
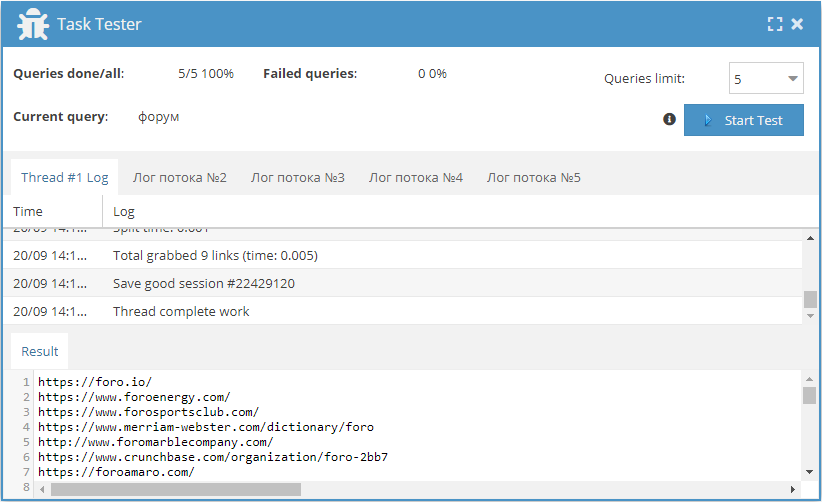
The following information is available in the task tester interface:
- Queries done/total
- Information about queries, number of completed ones, total number of queries
- Maximum number of threads - 5
- Maximum number of queries - 10
- Current query
- Number of failed queries
- Query limit selection
- Log for each of the 5 threads, where you can find full information about queries and errors
- Scraping result field
- If multiple result files are used, the content of each file is displayed
Test parsing
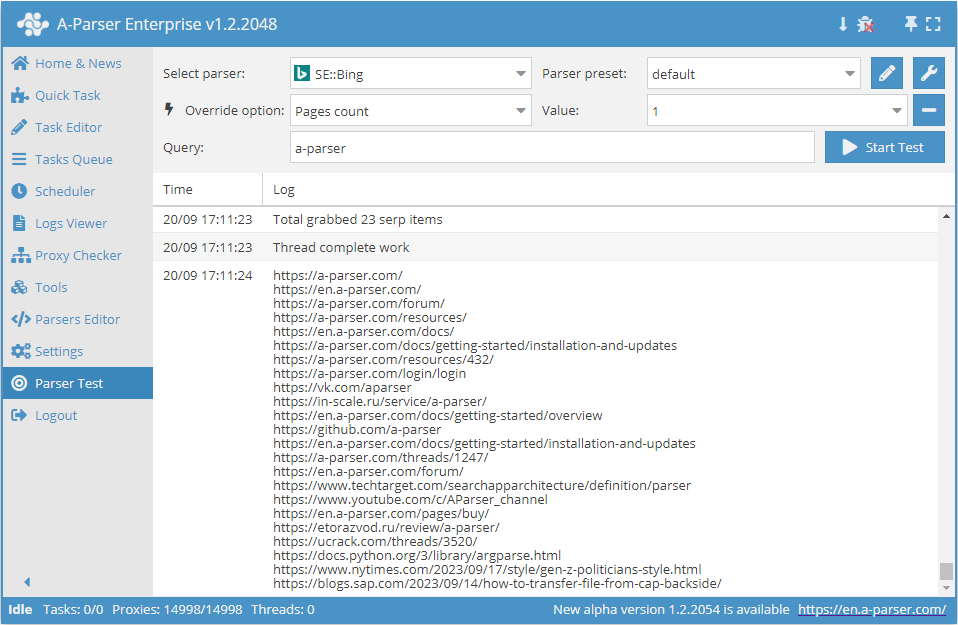
On the Parser Test tab, there is an option for test scraping to create and debug your own presets. Unlike the Task Editor, there is no possibility to use query and results builders, use multiple scrapers, macros are not supported, there is no multi-level scraping and other features that are supported in the task editor.
The section is created on the principle of a unit test, where you can test individual scrapers. The entire process is output as a log, which allows you to get detailed information about the scraper (preset) operation, from sending a request to receiving results:
In "Test parsing" there is a quick settings area: disabling autoscroll and enabling debug mode
 By default "autoscroll" is enabled - this means that as information is output to the log, we will automatically move down
 When "autoscroll" is disabled, the icon changes its appearance - this means that as information is output to the log, we will stay in place, there will be no automatic movement down
 By default, debug mode is disabled - this means that general scraping information will be output to the log.
 When we activate debug mode, the icon changes its appearance and detailed scraping information will be output to the log.
In the log window with debug mode enabled, we see detailed scraping information:
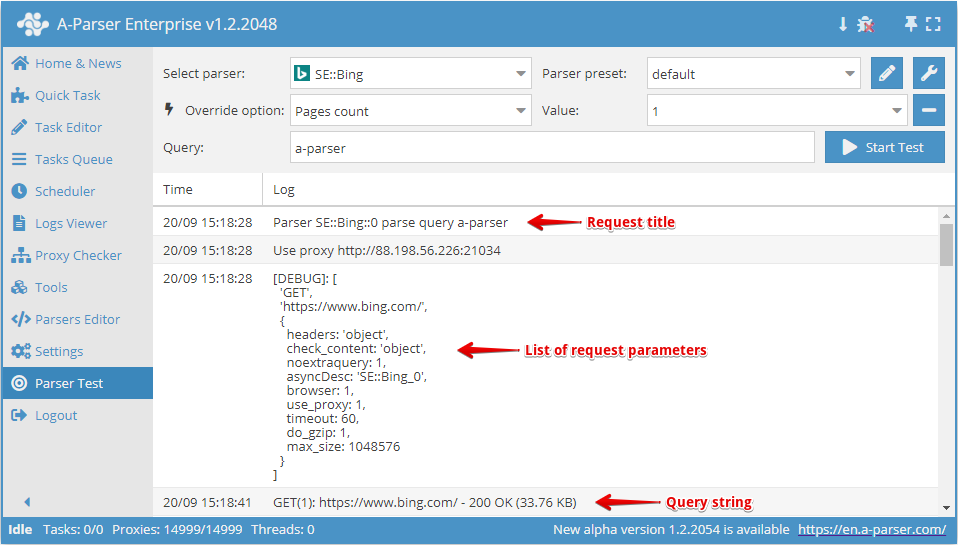
In the request part we can see:
- Request name
- Request string that is sent to the server
- List of parameters sent with the request (headers, encoding, filters, etc.)
In the response part that we receive from the server, we see the following information:
See in debug window - link to a window where the page received as a result of the request is displayed
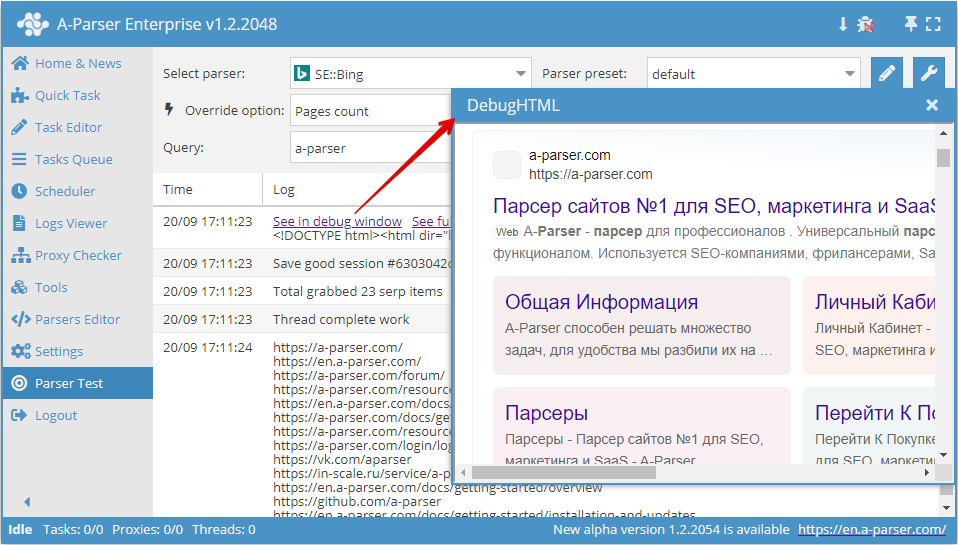
See full data - link to a window with the source code received as a result of the request
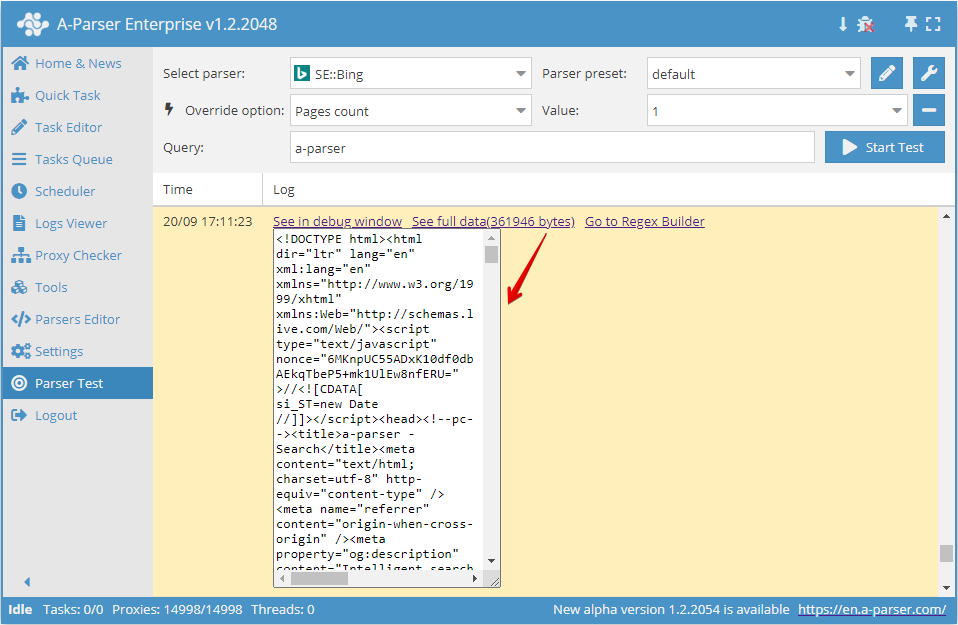
Go to Regex Builder - link to the Regex Builder with the source code received as a result of the request
While "autoscroll" mode is created more for viewing convenience, "debug" mode is an indispensable tool for debugging your own scrapers and presets. By analyzing the information obtained from the log in "debug" mode, we can see at what stage and what happens during task execution, how the request is formed, and what the scraper receives in response.